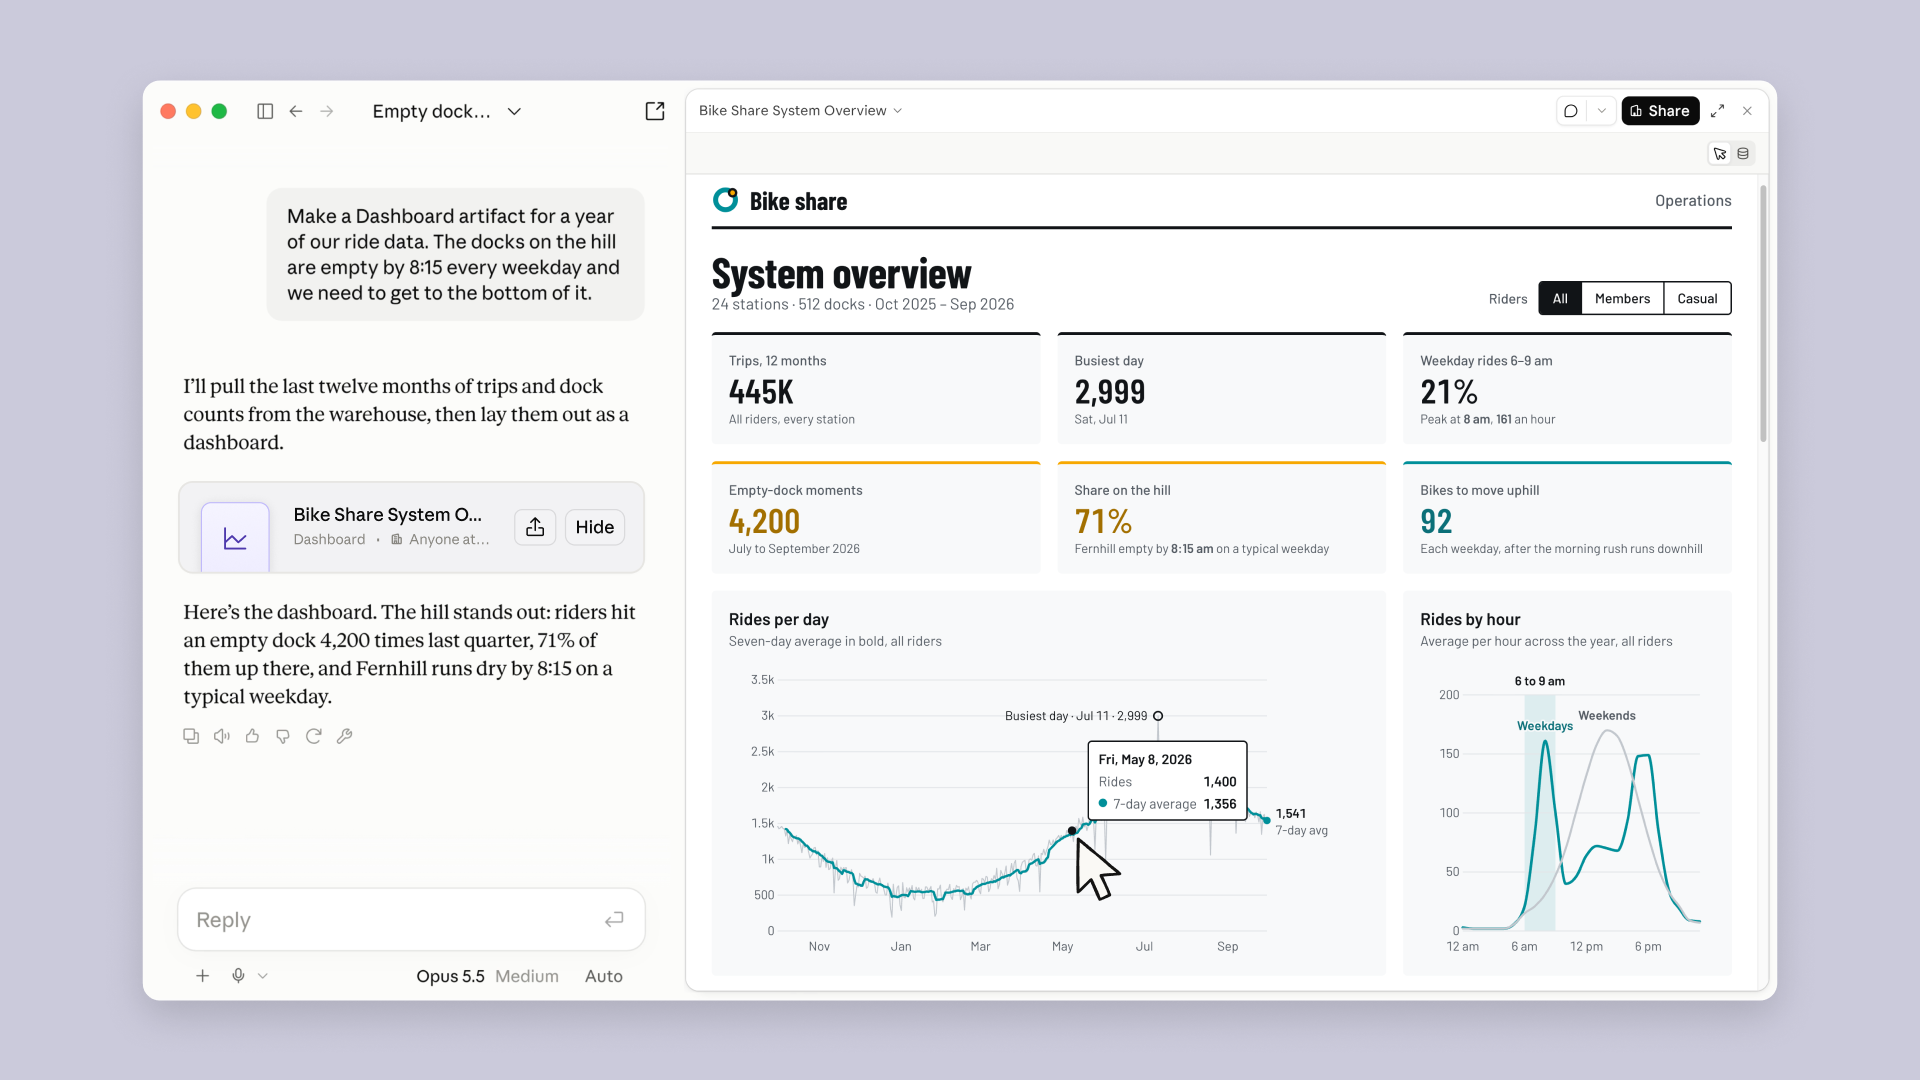
A dashboard Claude built from a year of bike share ride data. Screenshot: Anthropic
Claude Dashboards Turns Business Questions Into Live Dashboards: How to Track Your U.S. Expansion
On October 8, 2026, Anthropic launched Claude Dashboards in beta, as Reuters reported. You ask a question about your company’s data in plain language, and Claude builds a dashboard that updates as the data changes. For a company opening the U.S. market, that means answers on pipeline, sales and campaigns without waiting for a report.
What It Does
- Connects to your data. It works with Amazon Redshift, BigQuery, ClickHouse, Databricks and Snowflake, plus apps such as Salesforce.
- Shows its work. According to Anthropic’s Help Center, you can click any number to see the query behind it, and each chart shows when its data was last refreshed.
- Keeps data access in place. Dashboards start private, and when shared, each viewer’s own connections run the queries, so people see only the data they already have access to, as The New Stack reports.
- Reaches many plans. It is in beta on Pro, Max, Team and Enterprise, and Enterprise owners switch it on. Docs, Slides and Design also left beta for all plans the same day, per Reuters.
How It Compares
Anthropic positions Dashboards for quick, exploratory questions and suggests exporting to tools such as Amplitude, Grafana, Hex or Mixpanel for deeper analysis. The New Stack adds that OpenAI launched a similar Data agent about a month earlier, and that Snowflake and Databricks offer their own natural-language analytics tools. The New Stack also discloses that its owner, Insight Partners, invests in Anthropic and OpenAI.
What This Means for Your U.S. Entry
A new market produces numbers from day one, and a dashboard helps most when you decide in advance what to follow. Three steps to start with:
- Choose the three numbers that show whether your U.S. expansion is on track, for example qualified conversations, pipeline by state and cost per opportunity.
- Connect the system where those numbers live, such as your CRM, and ask one question at a time.
- Open the query behind each chart before you share it with your team or investors.
A useful habit with Claude Dashboards is to write down, before you connect any data, the decision each number will support. That keeps the dashboard focused on choices such as which state to prioritize or when to adjust a campaign, rather than on figures that look good but change nothing.
For a team that works across several countries, a shared dashboard also puts everyone in front of the same U.S. figures, with each person seeing what their own access allows. Weekly reviews then start from the same page.
Since the feature is in beta, its behavior may change, and dashboard work counts toward your plan’s usage limits.
The Bottom Line
Claude Dashboards shortens the path from question to answer. In a new market, the numbers you choose to follow shape the decisions that come next, so choose them early.
Are You Considering Expanding Your Company Into the United States?
Appalanca is an internationalization consultancy that prepares Latin American companies to enter and grow in the United States. We work with you to prepare, adapt, position, connect and grow in the market, and we start with a free consultation with our founder.
Let’s talk about your next market.
Sources: Anthropic, Claude Help Center, Reuters, The New Stack